Are Dave’s days numbered? Statistical Analysis of new SWFC signing Steven Fletcher

Comparison of Atdhe Nuhiu and Steven Fletcher applying xG & xA models

Nuhiu

With Sheffield Wednesday announcing their first summer signing ahead of the new 2016/2017 campaign, I have taken a look at how new recruit Steven Fletcher compares to current squad members, paying particular attention to Atdhe Nuhiu. Having played on loan at Marseille towards the end of last season, his contract recently expired at Sunderland meaning he could join the Owls on a free transfer.

Goals

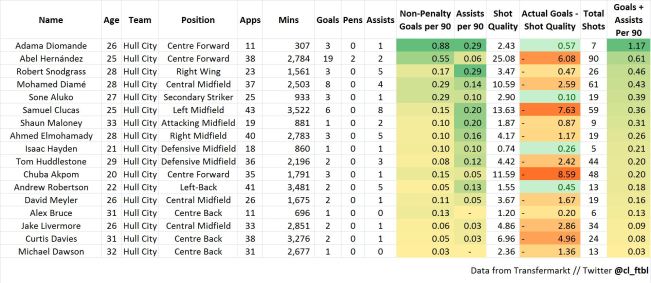
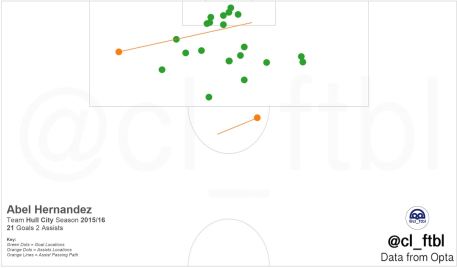
Steven Fletcher comes with a proven track record having played 7 seasons of Premier League football with Burnley, Wolves and Sunderland. As the stats from last season show, Fletcher instantly offers a greater goal threat than Nuhiu, before even taking into consideration a differentiation in leagues. He is also an overachiever in terms of goal output visible from the difference between Non-Penalty Goals and Chance Quality (xG). Just to briefly explain, Chance Quality looks at how many goals the average player would score when taking the same shots from the same locations as the player in question. As is clear from the difference, Fletcher overshoots by 0.07 meaning that his goal threat is 7% greater than the average player, playing the same amount of minutes and taking the same shots. Compare this to Atdhe Nuhiu who undershoots by -8%, Fletcher offers a 15% greater goal threat for the Owls.
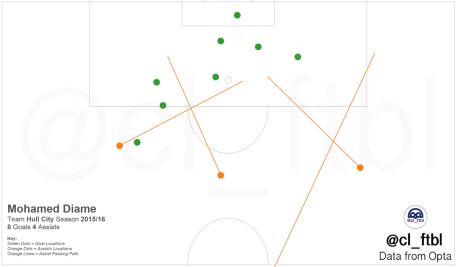
Assists

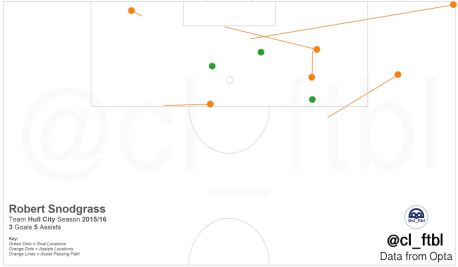
As he will more than likely be playing upfront with Gary Hooper, Fletcher’s stats would suggest a potential link-up between the two. The fact that he plays more through balls and creates more chances than Nuhiu, could compliment Gary Hooper nicely, particularly as Hooper looks to play off these through balls and finishing the chances created for him. Despite Fletcher not producing an assist last season, the Assist Quality (xA) stat tells us that from the chances he created 0.95 worth of assists probably deserving of at least 1 assist. Compare this to Atdhe Nuhiu who generated 5 league assists last season, the same model ranked his assist quality at 1.46. Compare these to the minutes played on the radar and Steven Fletcher comes out marginally on top meaning he is creating marginally better chances per 90 minutes played.

Pressing

As is a big part of Sheffield Wednesday’s playing style (and Atdhe Nuhiu’s for that matter) the defensive actions in the opposition half is of big importance. As you can see from the “Oppo Half Turnovers” section of the radar plot, Atdhe Nuhiu leads the way in winning the ball back in the opposition half, winning the back 8.23 times per 90 mins compared to 7.09 times per 90 for Steven Fletcher. The impact of this is that although it’s slightly less than Atdhe Nuhiu, he still fits the bill as he is still attempting to win the ball back, especially when viewed against other players such as Hooper who only produces 3.04 turnovers per 90.

So are Dave’s days numbered?

I personally believe that Atdhe Nuhiu’s days aren’t numbered. Despite his finishing being particularly poor he carries strengths in other areas of the field which make him an asset tactically. Although he will probably not be first choice since the introduction of Fletcher, his strengths could prove useful towards the end of games where his strong aerial presence and defensive work rate could prove useful in chasing a late goal or holding onto a lead.

output_6WlOPd

Why Sheffield Wednesday SHOULDN’T sign Ross McCormack…. for £8-£12 million anyway

Statistical Analysis of why Sheffield Wednesday should look to Gary Hooper rather than spending an inflated transfer fee on Ross McCormack.

Like my other articles, it’s early days in my writing career so please share any feedback/improvements by tweeting me @cl_ftbl on Twitter. Your feedback is crucial for allowing me to improve and I appreciate any feedback you provide. 

Following on from my last piece around rumoured transfer target Sabir Sarioglu which can be seen HERE. It was suggested to me on Twitter to do a comparison between Gary Hooper and rumoured transfer target Ross McCormack. While delving into the stats of both I came across some interesting discoveries which posed the following questions;

  • Is Ross McCormack worth the rather hefty price tag (Rumoured to be around £8-£12 million)?
  • Is he any better than what we’ve already got?

My answer to both questions from a purely statistical standing, surprisingly is probably NOT. Here’s why:

As you can see from the radar plot below, what is striking firstly is the Appearance per 90 statistic. Ross McCormack appeared in 45 of Fulham’s 46 games over the 2015/2016 season while Gary Hooper only joined the Owls on loan in October, missing the first 3 months of the season before making a permanent switch in the January transfer window. As a result Gary Hooper only accumulated 21.9 appearances per 90 compared to the 44.3 appearances accumulated by McCormack. This would suggest a couple of things, firstly, if Gary Hooper had played the same amount of time as Ross McCormack then you could expect similar, if not greater levels of output from a similar amount of playing time. Although this isn’t clear and there is a good chance the numbers are unsustainable, it gives a good indication of what is capable from Gary Hooper if he had played the same amount of game time as Ross McCormack.

radar-chart

Goals

As the radar shows Gary Hooper has greater Shot Conversion, Non-Penalty Goal and xG (Chance Quality) stats. This tells us that for the minutes played, Gary Hooper was actually more prolific and carried a greater xG (Chance Quality) threat, getting in better scoring/shooting positions per 90 for the minutes played. The radar shows that Ross McCormack takes more shots per game and because of this his shot conversion % is a lot lower, this is more than likely due to the shot position with him taking more long shots as oppose to him being an inferior finisher.

Assists/Build-Up

While it’s clear to see that Ross McCormack dribbles the ball past more opponents per 90 (0.34 vs 0.23) and does slightly more work defensively than Gary Hooper, his output in terms of assists tells a similar story to his goal threat. McCormack generates 0.2 assists per 90 mins, only 0.02 greater than Gary Hooper (0.18), this again would suggest that should Gary Hooper have played a similar amount of time as Ross McCormack he could achieve something similar to the 10 assists McCormack accumulated last season. The greater levels of key passes (passes that lead to a shot) further backs up this point as Gary Hooper is making more key passes per 90 (1.46) compared to 1.38 for McCormack, meaning that Hooper may only be behind on the assists per 90 stat as McCormack’s key passes could have a better finisher on the end of them, or the key passes attempted by Hooper aren’t as good as the one’s McCormack is attempting. One clear positive that Gary Hooper has over Ross McCormack is the greater headed dual win % success (31.15% vs 12.5%) meaning that he carries a much greater aerial threat which is important to Sheffield Wednesday’s style of play for the volume of crosses they attempt. Despite this the Owls could maybe facilitate both players by moving Forestieri to the left and playing Hooper in a target man role alongside McCormack.

Conclusion

In conclusion, I’m not suggesting for one moment that Ross McCormack is a bad player, or is better than Gary Hooper, but perhaps the Ross McCormack statistics don’t tell the full story and perhaps people are falsely perceiving them as being better than they are, overlooking, overvaluing and failing to account for the minutes played. The numbers would suggest that Sheffield Wednesday have a more prolific striker on their hands and instead of spending the vast sum of money recruiting McCormack, they could turn their attentions to getting Gary Hooper fit and firing to achieve similar appearance/minutes statistics as Ross McCormack next season, potentially generating similar levels of output with the £12 million still in their pocket. Despite this, it must be noted that there is the risk that Gary Hooper might not sustain his current output, as there is the chance McCormack might not, so this is a £12 million risk the Owls will have to make as they aim to recover from the play-off final defeat and reach the Premier League in their 150th year as an established football club.

Don’t forget to tweet me your feedback on this article @cl_ftbl. Please also don’t forget to retweet/favourite the article if you enjoyed it, because the more people who see and engage with my posts, the more reasons I have to dedicate more time and write more posts!

Rumour: Sabri Sarioglu | Sheffield Wednesday Recruitment Analysis | #SWFC

An analysis of rumoured Sheffield Wednesday transfer target Sabri Sarioglu.

Like my other articles, it’s early days in my writing career so please share any feedback/improvements by tweeting me @cl_ftbl on Twitter. Your feedback is crucial for allowing me to improve and I appreciate any feedback you provide.

With the season finally over and full focus now onto to next season, I have decided to start doing a bit of writing on recruitment analysis and on potential signings for the new season. Like this rumour, it won’t be random names plucked out of thin air, it will be taken from a variety of sources (See below) with the rumours having a bit of substance. With us now delving into the foreign market, I felt there could be a bit of a gap writing around these links and comparing their statistics to the players we currently have at our disposal. This could be particularly interesting for any new signings that most fans don’t know much about. For this particular article my comparison will be to the current first choice right-back, Jack Hunt. So I hope you find this article interesting and informative and if you do enjoy it please ensure you share it around as the more interest these articles generate, the more reasons I have to write them.

Name: Sabri Sarioglu

Age: 31

Main Position: Right-Back

Current Team: Galatasaray

Contract Expiry Date: 30th June 2016

Previous Clubs: None

Nationality: Turkish

International Appearances: 43 (2 goals)

Data: Transfermarkt

radar-chart

In order to compare the two players I’ve created a @mixedknuts inspired radar plot comparing the two players statistics over the last season. In order to add a bit of context allowing comparability to the team strategy, I have tried to focus around how these key statistics relate to what makes a suitable full back in Carlos Carvalhal’s style of play. These characteristics are as follows:

Attacking Proficiency

As the radar shows, Sarioglu is more of an attacking threat. Despite both not scoring in league football last season, Sarioglu contributed 5 assists compared to the 1 assist from Jack Hunt. Although I’m not a fan of just showing raw assist figures, it does suggest that recruiting Sarioglu would increase attacking output from the right back position where we didn’t see much output last season from Hunt on the whole. The Key Pass figure shows how many passes a player made that turned into a shot, the fact Sarioglu generates slightly more key passes per 90 further strengthens the argument for Sarioglu.

Crossing/Cutbacks

As Wednesday fans will know, The Owls work tirelessly in the warm-up getting the ball out wide into crossing positions, to deliver into the centre. As the radar shows Sarioglu makes more crosses per 90 mins played than Jack Hunt, while this suggests Sarioglu makes more crosses, it could also indicate Sarioglu’s crosses come from potentially less fruitful positions, although this requires further enquiry.

Impacting Final 3rd

The image below shows the average position of each player, and the passes they made that generated an assist. As you can see the average position Sarioglu takes is further forward than Jack Hunt, combine this with the final third touches stat from the radar, it shows Sarioglu would be a better option for making impact in the final third. The final third impact becomes particularly important as Sheffield Wednesday play with narrow wingers looking to cut inside (See Ross Wallace on this image), so the fact Sarioglu is able to make a more efficient impact from full-back is better suited to the playing style than Jack Hunt.

Pitch

High Pressing

Carlos Carvalhal encourages a game of high pressing and to assess this statistically I have plotted all defensive actions and plotted the average position as the big points. The theory behind this would be the higher up the pitch the average defensive action is, the higher up the pitch they press opponents. Ignoring the pitch width, you will see that Sarioglu’s point is slightly higher, suggesting that he would be a greater pressing option than Jack Hunt. Clearly this would require video evidence but it’s the best measure I could come up with the data I have available.

Pitch tack

Jack Hunt Advantages

As the radar suggests Sarioglu isn’t better than Jack Hunt in every statistic. From watching him in person it is clear to see that Jack Hunt is a very direct/risky player who looks to take opposition players on with his pace. This is clear to see from the Dribbles statistic as Jack Hunt dribbles past nearly twice as many players per 90 as Sarioglu, one potential knock on effect of this is that it could explain why he is dispossessed a lot more per 90. Another advantage of playing Jack Hunt is that age is on his side, with him being six years younger than his comparative. The effect of this is that while Sarioglu is potentially a better option short-term, Jack Hunt will probably be able to play for a lot longer making him a more suitable option longer-term.

Conclusion

To conclude, I feel that signing Sarioglu would make statistical sense (ignoring wage demands) as his stats outweighed Jack Hunt’s in the key areas discussed above. As is clear, Sarioglu offers a greater attacking threat contributing more assists and making more crosses whilst attempting less risky dribbles per 90, which is important to the Sheffield Wednesday style of play. With Sarioglu also being dispossessed a lot less per 90, he becomes a stronger defensive option losing the ball on less occasions, in turn suggesting less defensive errors leading to less goals conceded overall.

Rumour Sources:

HITC / Haberler / Shoot.com

Don’t forget to tweet me your feedback on this article @cl_ftbl


PLAY-OFF FINAL DEFEAT | SHEFFIELD WEDNESDAY POST-MORTEM

Post-mortem into Sheffield Wednesdays defeat in Play-off final against Hull City

Like my other article, it’s early days in my writing career so please share any feedback/improvements by tweeting me @cl_ftbl on Twitter. Your feedback is crucial for allowing me to improve and I appreciate any feedback you can give me.

The purpose of this post is to complete a post-mortem into the defeat Sheffield Wednesday suffered in the Play-off final against Hull City. As a Sheffield Wednesday fan myself it was certainly a hard pill to swallow but everyone connected with the club should be proud of the progress we have made over the last 12 months. It would be unfair to start criticising individual performances as this is not what I’m here for, I will be focusing on what Hull City did well and how they nullified the threat the Owls posed and prevented us from playing our natural game.

Steve Bruce named an unchanged side whereas Carlos Carvalhal opted for one change bringing in Sam Hutchinson at the expense of Alex Lopez. The purpose of this change was certainly a tactical one with Hutchinson a more defensive option providing additional support to the centre-backs and managing the threat Diame posed, particularly the late midfield runs I spoke about in the opposition analysis.

Hull v Sheff Wed
Hull v Sheffield Wednesday – Chance Quality (xG) Map

Overall, Hull City edged the game and deserved their win with a chance quality (xG) of 1.91 compared to a chance quality of 0.77 for Sheffield Wednesday. As discussed before, the meaning of this is that you would expect an average team to score 1.91 goals for the chances Hull City created and 0.77 goals for the Sheffield Wednesday chances. The overall impact of this is that Hull City created more, and had the better chances meaning they probably ran out deserved winners.

HullCity_GIFSheffWed_GIF

Above are GIF’s comparing the passing networks for each team for the Play-off final to the respective Play-off semi final winning games, incidentally both in the first leg. If you have watched Sheffield Wednesday much this season then you will know how important play through the centre of the park is to the playing style. The wide men will look to sit narrow dragging the opposing full backs inside creating space for Hunt and Pudil to overlap and create overloads. (I might do an article on Sheffield Wednesdays playing style if there is enough interest, please let me know if so)

If you firstly look at the Hull City map you can see how much deeper Huddlestone was operating and how much higher the two central defenders were. This prevented any space between the defensive and midfield lines meaning Forestieri and Hooper were unable to get on the ball and found themselves isolated for a lot of the game. If you then look at the Sheffield Wednesday map you will see Wallace taking up a much wider position and Hooper in a much deeper position, this was forced upon due to the lack of space in the middle, so they had to move positions to try and get on the ball. You will also see how much higher Elmohamady and Odubajo were operating on the Hull City right, which explains why Pudil was in a much deeper position and struggled to get forward as he found himself pinned back.

Crowded Out SWFC.gif
Forestieri crowded out, no support and Hull turnover

Hull were pressing really quickly in their own half and remaining tight to Forestieri and Hooper meaning that the Owls were unable to get the ball into their forwards feet, when they did find feet they struggled to get support around the receiver allowing Hull to crowd them out and force a turnover in play. The one time the Owls managed to get the ball into feet Forestieri turned Dawson on the 8th minute and was in-behind the Hull defence until he was cynically brought down. The Owls were patiently moving the ball across the backline for a lot of the first half probing the Hull defence, but they found it difficult to find a rhythm and play their natural game.

Hull’s key player on the day was certainly Mohamed Diame. He was causing some real problems for the Owls winning the ball back in midfield and driving at the Owls defence. You could see the Owls were struggling to cope as he hit the post early on from one of those driving central midfield runs. Although I don’t have the video, the Owls had put in preventative measures to deal with this as Kieran Lee was following the third man runner on many occasions, but on this occasion Diame managed to find the space on a counter attack. Diame’s range of passing was another threat identified in the opposition analysis proving effective, his through ball in the 29th minute sent Hernandez one-on-one which would have put Hull one up but for a fine save by Kieran Westwood.

Diame Drive.gif
Diame driving run, hits post

It’s clear to see that Diame is a quality player and should be playing at a higher level but having spoke to a lot of Hull fans he, like a lot of their team struggled to find consistency over the course of the season, which explains why they didn’t finish in a much higher league position. The link between Diame and Hernandez is at the heart of everything Hull City do so well, retaining both of these will be crucial to their Premier League status next season.

As a Sheffield Wednesday fan I would like to congratulate Hull City on their win and wish them all the best for the future.

Don’t forget to tweet me your feedback on this article @cl_ftbl


HULL IN NUMBERS | OPPOSITION ANALYSIS OF HULL CITY FC

This is my first attempt at an article of this kind so I would really appreciate it if you could share your honest feedback by tweeting me @cl_ftbl

Hull City booked their place into the Championship play-off final as they ran out 3-2 winners on aggregate against Derby County over two legs. Despite a 2-0 home defeat in the second leg, their efforts in the first proved to be enough where they secured a 3-0 victory at the iPro Stadium. The purpose of this post is to analyse the threat Hull City pose through their playing style and identification of key players. Hull finished the league in 4th position as the fourth top scorers in the league with the second best defence in the division. (only Middlesbrough conceded fewer goals)

Formation

Hull Last 3.gif


Hull’s formation is apparent from the Season Passing Network operating in a 433 formation with Hernandez the most advanced central striker, supported by Snodgrass and Elmohamady on the left and right respectively. You can expect to see Huddlestone as the deepest lying of the three midfielders playing as a pivot allowing Livermore and Diame to get forward and support Hernandez. Snodgrass has spent a lot of the season playing on the right but has recently switched to the left as Clucas dropped out with Elmohamady his replacement. The fullbacks will tirelessly get forward with Robertson on the left who is technically very good and Odubajo on the right who is equally as good but has a more direct approach and is comfortable on both feet.

Playing Style

Hull like the to get the ball out wide quickly and utilise the attacking abilities of their full backs. Odubajo and Robertson will get forward at almost every opportunity and the threat of Elmohamady coupled with Odubajo on the right is an area Hull will look to exploit. The exploitation of the flanks is backed up with the solidity of the midfield who are all 6 foot plus with proven Premier League experience. Hull will look to use this physicality to dominate the midfield so it’s crucial this threat is managed. Late forward runs from the midfield trio are also a threat especially from Diame who has weighed in with 8 goals and 4 assists this season.

9rm1qP.gif
Diame goal from supporting run

Goal Locations

The goal chart below shows the location of all Hull City’s goals this season. As you can see 92% of Hull’s goals came from inside the box with 59.4% coming from the right hand side of the goal and 40.6% coming from the left.

Hull Goals
Hull Goal Locations

Assist Locations

The Assist chart below shows the assist locations joined with a line to where the eventual goalscorer collects the ball. The chart shows a lot of balls from the left to the right which explains why 59.4% of Hull’s goals have come from the right hand side of the field.

Hull Assists.JPG
Hull Assist Locations
Z6RY5E.gif
Robertson Assist Left-to-Right

Key Players

The Goal scoring table gives a clear indication of Hull City’s three most potent threats who will require special attention:

Hull City Player Stats.JPG
Hull Player Stats 2015/16

** Shot Quality – Based on historic shots, how many times the average team would score from a shot in the same position (For more info search ‘Expected Goals’) **

  1. Abel Hernandez

Abel Hernandez is without doubt Hull’s greatest goal threat having scored 21 goals this season equating to 30% of Hull’s total goals overall. He weighs in with a goal or assist 0.61 times for every 90 minutes played which is just over 1 goal or assist in every 2 games he plays. Despite this his shot quality is a negative figure meaning that he should probably have scored more, as the model suggests the average player would score around 25 goals for the same shots he took. Despite this Hernandez is an all round finisher scoring goals with both feet from all different angles which is apparent below. The image also shows all of his goals came from inside the area so it’s of paramount importance that he is closed down should he gain possession of the ball inside the box.

Abel Hernandez
Abel Hernandez Goal and Assists 2015/2016
  1. Robert Snodgrass

Robert Snodgrass is the second most influential player with 3 goals and 5 assists this season. Despite not being involved much at the start of the season due to injury, he has began to find consistency and has made 23 appearances playing 1,561 minutes overall. Again his goals and assists are coming at a rate 0.46 for every 90 minutes played which is just under 1 in every 2 games and he will be a real threat. The majority of his impact is made on the right hand side where he has played a lot of the season but has since moved across to the left.

Snodgrass Goals & Assists.JPG
Robert Snodgrass Goals and Assists 2015/2016
  1. Mohamed Diame

Mohamed Diame is next most influential player from central midfield making 37 appearances this season totalling 2,503 minutes. Diame’s goal tally of 8 for the season is testament to the dangerous late forward runs the Hull midfielders make as the image shows 7 of his 8 goals coming from inside the box. With 4 assists to add to the total we can see that his goals and assists are coming at a rate of 0.43 per 90 minutes played which is only slightly less than Robert Snodgrass. The goal’s Diame creates tend to be balls from a central area around 25 yards out played through the lines with Hernandez being the beneficiary on 3 of the 4 assists.

Diame Goals & Assists.JPG
Mohamed Diame Goals and Assists 2015/2016
qx97G3.gif
Diame assist for Hernandez

I hope you found this brief overview of Hull City interesting, please share if you did and make sure you tweet me with any feedback/suggestions as this is my first article.


*NOTE – Games are from the regular Championship seasons only (Cup & Play-off games aren’t included)

**NOTE – I am not accountable for the accuracy of the stats as I am not collecting them, so any errors are out of my control unfortunately